The Visuals of Redash
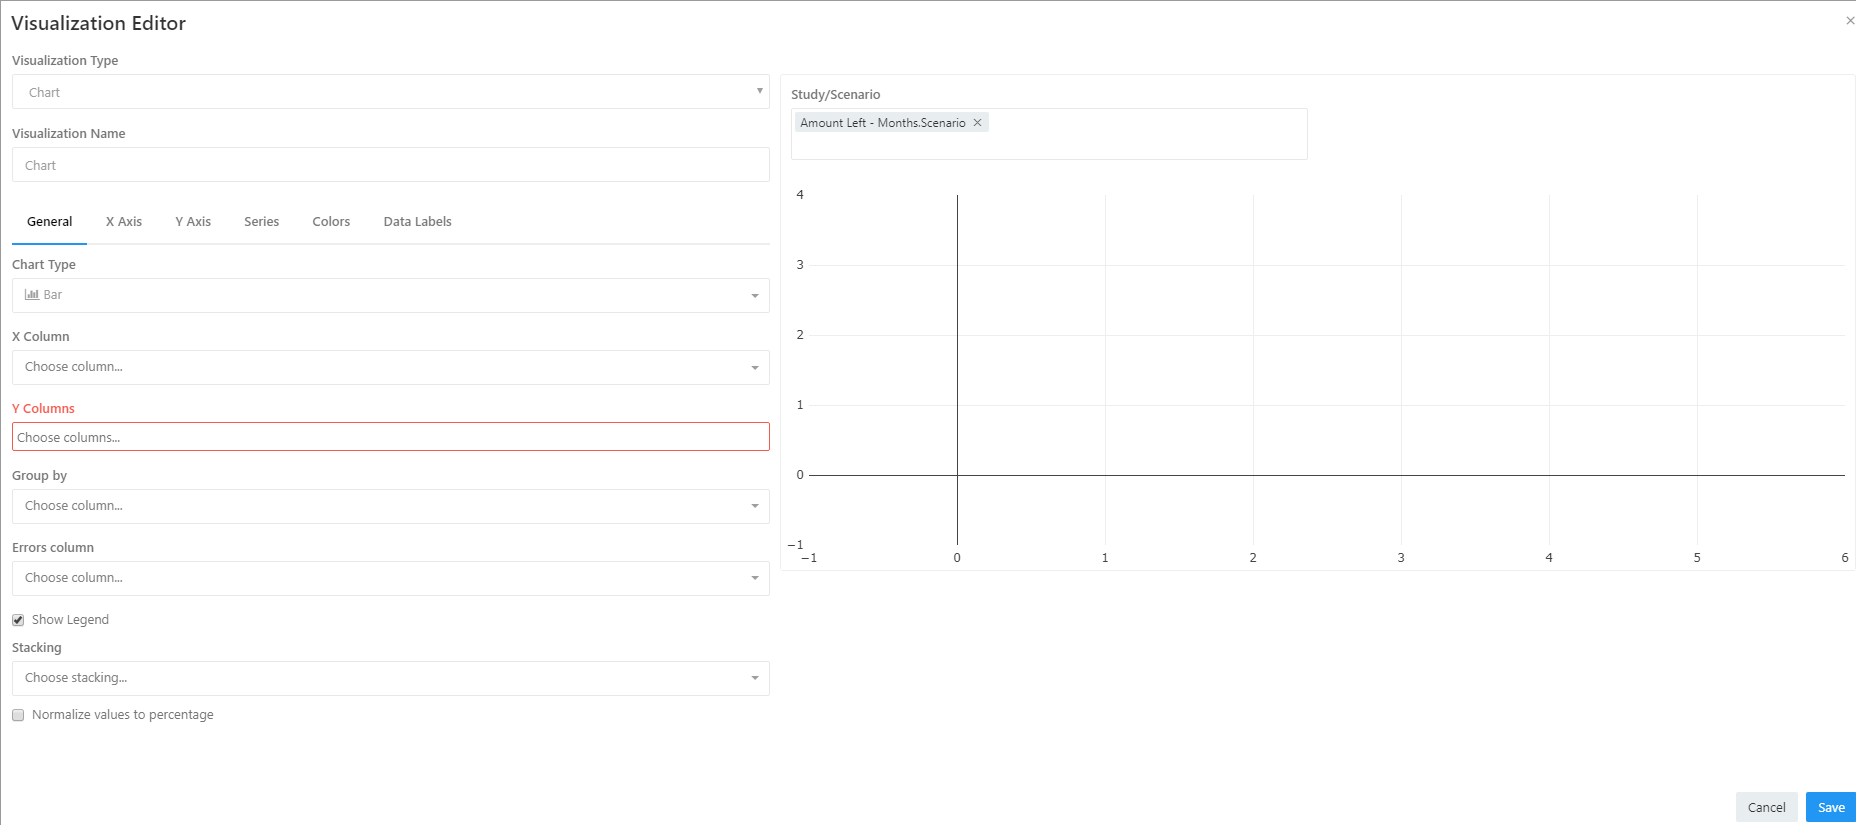
Once a query has been executed and the data has been pulled into Redash users can create visuals. These visuals can be added to dashboards once completed. To create a new visual click on the New Visualization button at the top of the visualization window.
A new visualization window will popup and users can start creating their visuals.
There are three features that can be changed when creating a new visual:
- The visualization type;
- The name of the Visual; and
- The features associated with the type of visual selected.
For example the requirements for a chart visual differ from those of a table visual and those of a sankey visual. The types of visuals that can be selected are listed here on Redash’s website.
Akumen supports the whole list of visuals however is it assumed that users will be more interested in creating table and chart visuals.
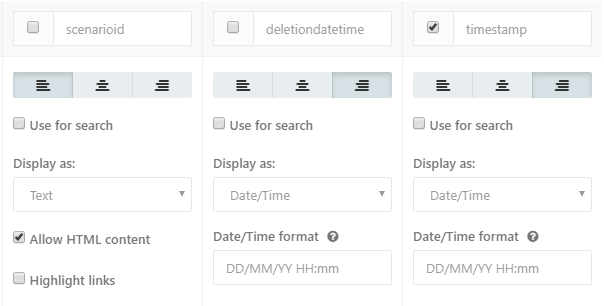
Once users have selected the the table visual they can start customizing the table visual. The table requirements are fairly simple. All users have to do is select the columns they want to display in the visual. They can also adjust how the text is display and in what format.
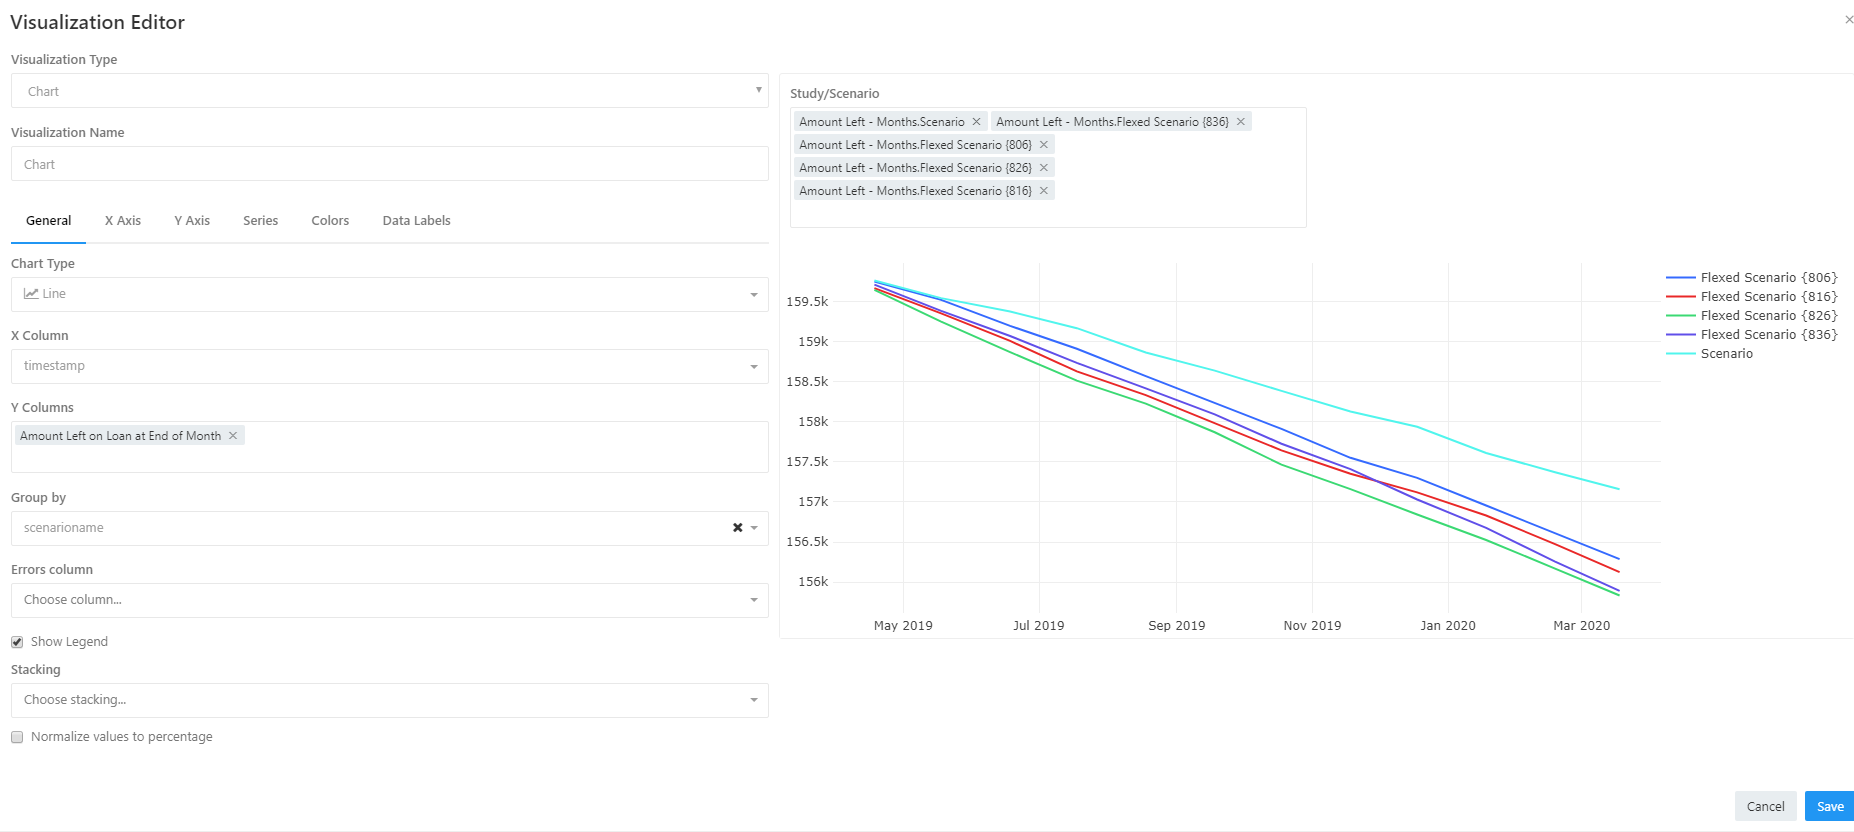
For chart visualizations users can customize the type of charts they want to use and what data they want displayed on the chart. In the screen shot below a line chart was used, and the requirements were selected to display the show result.
Once any visual has been completed in the visualization editor, users must press save. This will allow your visual to be saved to the query and be accessible via dashboards. Users can always go back and edit their visuals by selecting the Edit Visualization button at the bottom of the query screen. Next ot this button are three vertical dots. This is the visualization options button. By clicking on this button users will be able to add any initial visuals to the model dashboard.
For more information on Redash visualizations click here.


