Extract-Transform-Load
Performing ETL activities consume a significant part of the average data science workflow. With Akumen, we aim to streamline it somewhat by using PETL - a Python ETL library and makes transforms relatively simple. This model is simple, because there isn’t much ETL required for this dataset - it’s all basically in the format that we need. Hence, we just perform some minor transformations to show the workflow.
To create an ETL model, you can do the following:
- Go to the App Manager, and select
Create Application -> Python Model, namedETL - Breast Cancer. - To use PETL, we need to include it in the build environment. Create a new file called
Dockerfile(which will be created from a template) and add thepetlinstall line as below:
- Clear out
main.pyand add the following, step-by-step:
The first line imports petl, the Python ETL library. The second line imports a helper from Akumen’s API functions, get_results, which retrieves data from another model’s execution. We’ll use this to get the data from our data connector in the previous section.
This section is our standard Akumen wrapper function and parameter definitions. In this model, we take three parameters:
data- a scenario input that points to our Connector model. We use this withget_resultsto retrieve the connector’s result data (which is our breast cancer data).view- the name of the view that we want to retrieve results from. For our connector, this isdata_vw.scope- the scope level that we want to retrieve data for. We’re only retrieving data from a single scenario, soscenarioscope is fine.
Using get_results, we retrieve the dataset from the Connector model and pass it into petl. get_results returns a dataframe, which is easily imported into petl for modification.
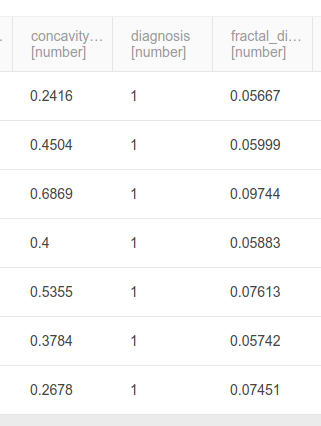
As a simple modification, we reform the diagnosis column into a binary integer format. petl provides a large number of transformation functions that can be used, but other libraries or code can be used here too - fuzzy matching, integration, or others.
We also want to cut off some Akumen-standard columns, so they’re not duplicated by this model.
And we return the resulting dataframe for output.
The entire resulting file is below:
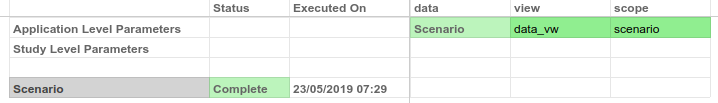
For inputs, you should use:
data: the connector model we previously built.view:data_vwscope:scenario
Execute the model and go to the data tab, and you should see that the diagnosis column is now 0/1 instead of B/M.