Setting Up the Reports Tab
Whenever a user runs scenarios in an application and and those scenarios return as complete the results are sent to the Data tab. Any table in the data tab are automatically available in the reports.
Akumen’s reports provide an interactive results dashboard where users can create graphs and other visuals in order to view their model’s results.
However the process of creating reports for Driver Model and creating reports for Python and R vary.
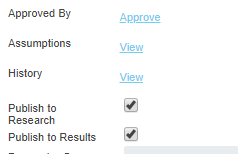
To access Driver Model results users need to ensure that the tick-box in the properties box of each node which says Publish to Results has been selected. If that box has not been selected then there will be no results for the query to draw from.

 . An chart icon will appear on the node indicating it is published to results.
 ![]()
![]()
For Python and R users there needs to be a specified output in the return {} or ret() section of the code. If there is no output specified then there will be no data for the reports to draw from.
For more on how to create Reports for both Driver Models, Python, and see the Reports section.