Creating A New Driver Model Report
The first of the report options we will discuss in the Driver Model Report.
To set up one of these reports:
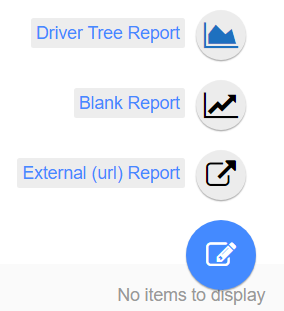
- Select Driver Model Report from the options list.


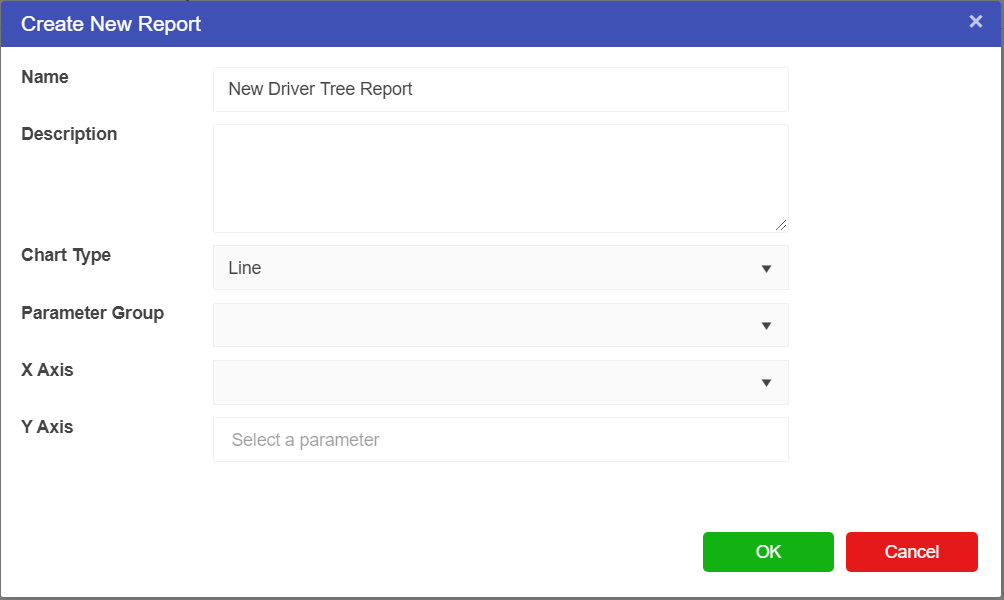
- The Driver Model Report window will open.


- From here you can set up the graph.
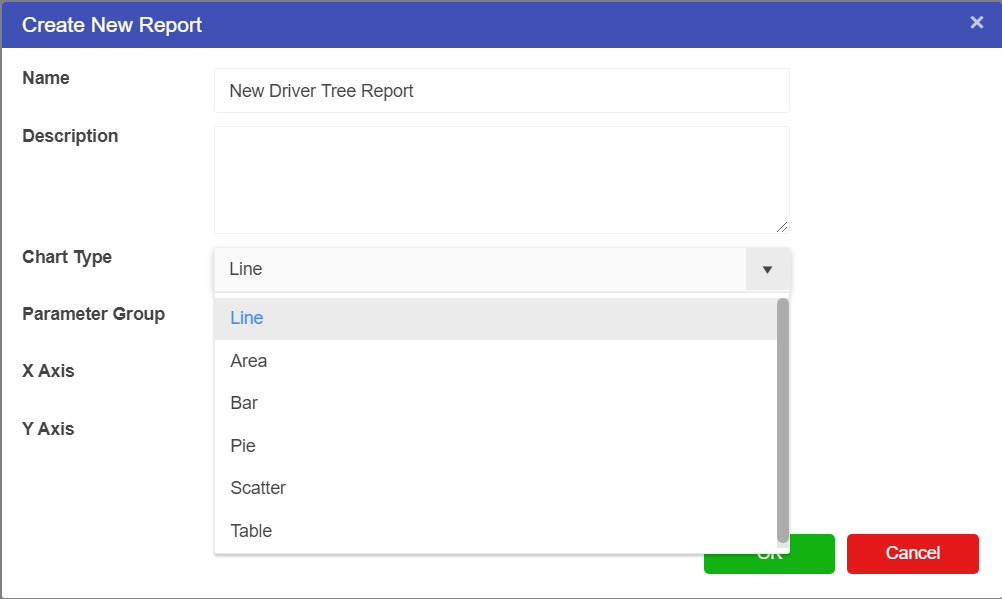
There are a lot of different types of graphs users can create (see image below)


Info
If you are using a Timeseries node in your model and you select Line, we suggest that the data selected for the X-axis is set to timestamp. This will ensure that the results of the model can be viewed over the period of time specified by the Timeseries Node.
By default, Akumen includes an internal “Parameter Group”. This is Akumen’s way of grouping parameters into respective output tables. Most database engines support a maximum of 250 columns (this could be more depending on datatypes within the columns). Each parameter group is a new table, each of which can have their own 250 columns.
Once all the elements of the chart have been set click OK
You will then be transported to a reporting dashboard where your chart will be on display.