Results Dashboards
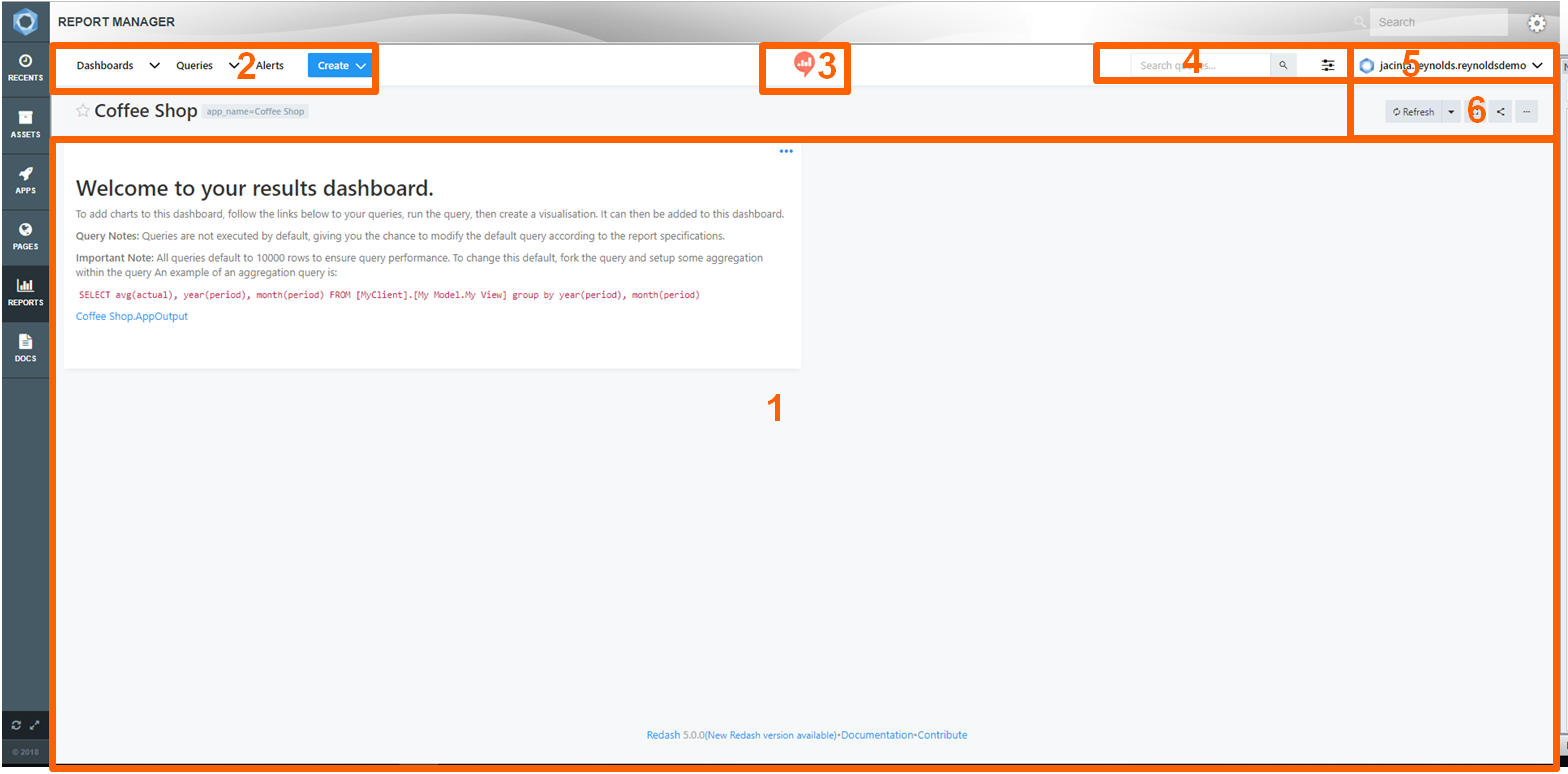
When users create a Blank Report they will be brought to a full screen image of the redash dashbaord. By clicking on the Full Screen button ( ) at the top right of the screen users will be able to see redash’s navgiation bar at the top of the screen.
The Redash dashboard has six parts to it:
- The Dashboard;
- The Menu;
- Redash Favorites Link;
- Search Bar;
- User Options; and
- Dashboard Options.
It is on this dashboard that users can add charts (called visuals by redash) tables, text boxes, and if desired (and connected to other models) other results from other models to create an interactive and informative display of results.
To add visuals and graphs to the dashboard:
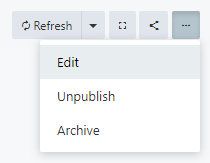
- Go to the dashboard options and click on the three little dots on the right hand side of the list
 .
. - Select Edit from the options list.

- Your Dashboard will change into edit mode so that you can make changes to it.
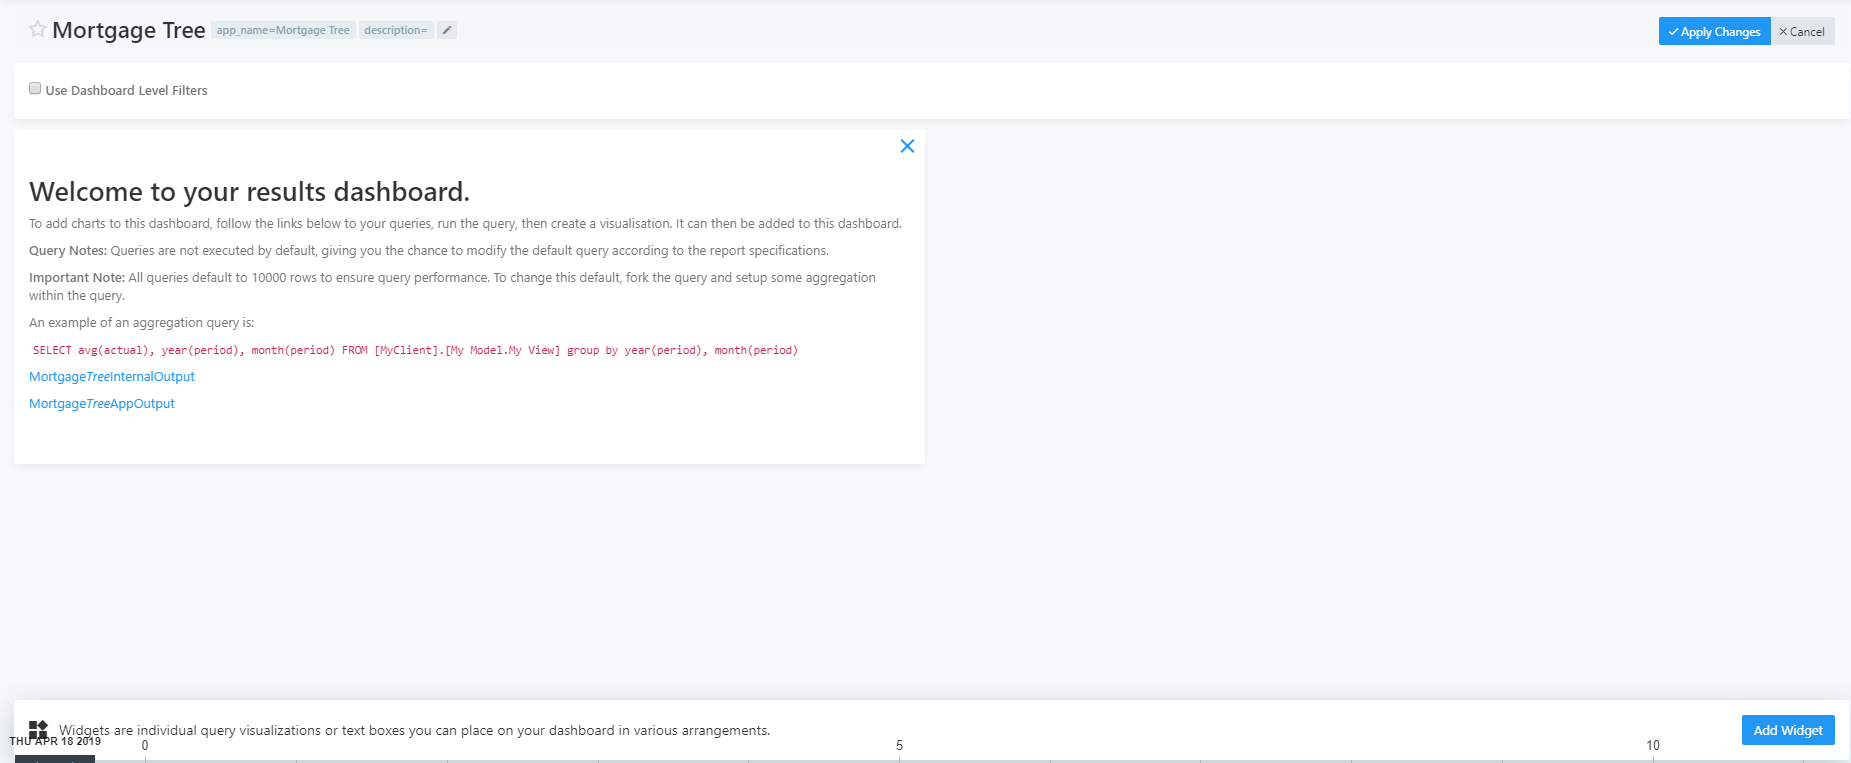

While you are in the edit mode of the dashboard you can:
- Add widgets (an individual visualization or text box from queries that can be added to the dashboard for instant viewing);
- Edit and resize widgets;
- Delete widgets; and
- Apply dashboard level filters.
To add a Widget to the dashboard click on the Add Widget button at the bottom right hand of the screen.

 When you click on Add Widget a list will appear with two tabs, Visualizations and Text Box. In the Visualizations tab only existing visualizations for that model will be available for selection. Users can also search for visualizations when there is a very long list. When a visualization has been selected, click Add to Dashboard at the bottom right of the Add Widget window.
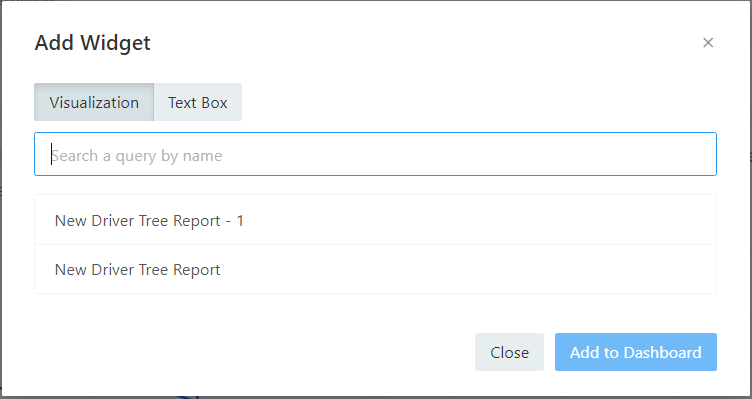

To add a Text box simply start typing into the Text Box. Then when you are happy with the information select Add to Dashboard at the bottom right of the Add Widget window.
Once a widget has been added users can resize them and move them around on the dashboard display, then once all the desired changes have been made they will need to save those changes by clicking Apply Changes at the top right of the screen.


For more information on Redash dashboards click here.
