Setting Up Python and R Reports
For Python and R users, the reports dashboard is actually an reporting system called Redash which has been integrated into Akumen. Model results can be accessed via the Report tab within the model or via the Reports section of Akumen.
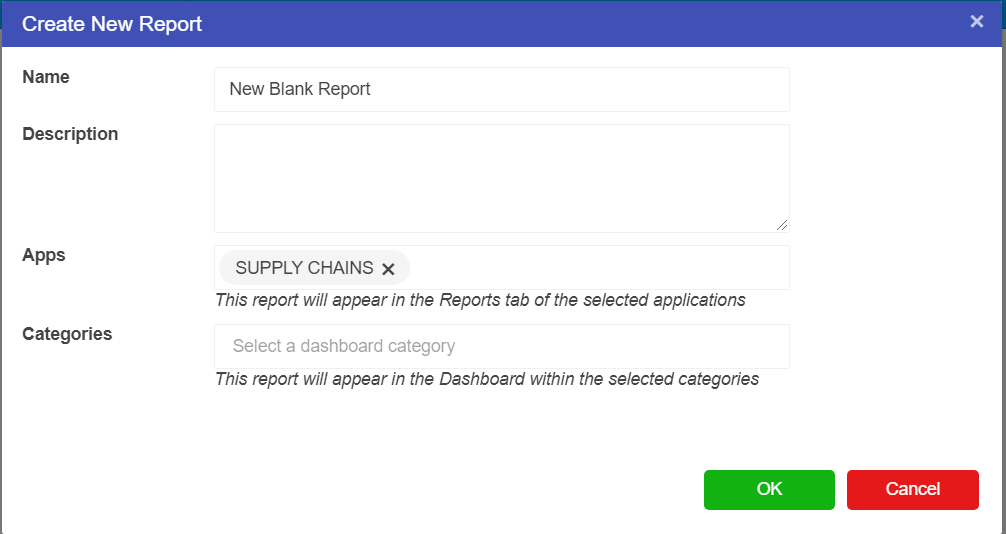
To create a new Report:
- Hover over the “+” at the bottom right of the screen.
- Select Blank Report from the report options list.
- Make sure that all Apps you want to be connected to this report are by checking the App names in the Apps box.
- Click OK.
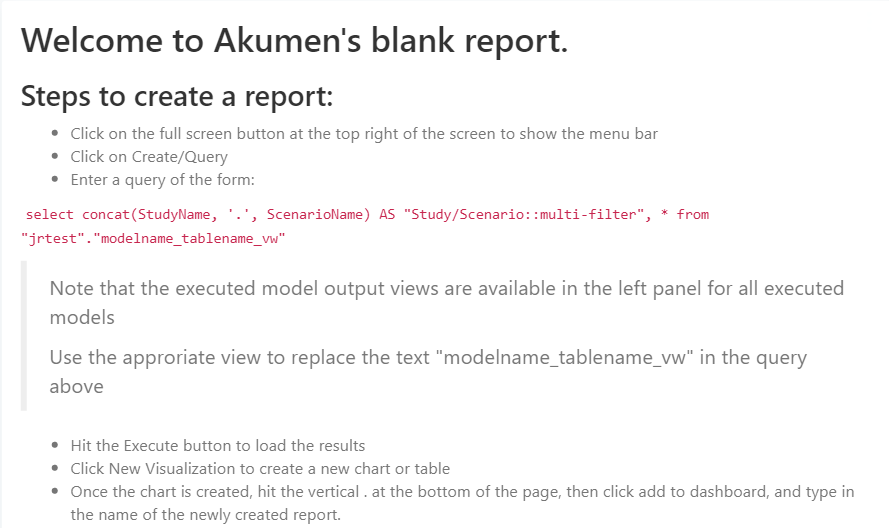
You will then be presented with your blank report.


On the screen there will already be a text box on the dashboard. This is the Welcome Widget (a widget is any window, text box or chart, on the dashboard).


This widget explains and tell users how to create their first report and how to add it to the dashboard. For Python and R users this widget will help you to set up your reports and add them to the dashboard.
For more information on Redash and how its reporting system works please click here. The link will take you to the Redash chapter of the documentation where we discuss:
- Dashboards;
- Queries; and
- Visuals such as Charts and Tables.