Creating Reports for a Driver Model
Driver Model reports for Akumen are very simple to set up. Once the Coffee Shop Driver model has been excuted, and the scenarios have returned as complete users will be able to create a Driver Model report.
To access the reports page click on the Report tab at the top of the model page.
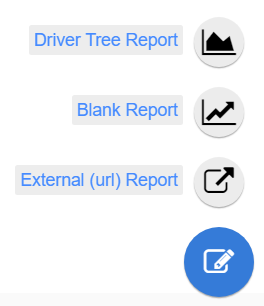
In the Reports page users will see a “+” button at the bottom right of the screen. By hovering over this button users will be given the option to create 3 different types of reports:
- A Driver Model Report;
- A Blank Report; and
- An External (URL) Report.
Select Driver Model Report.
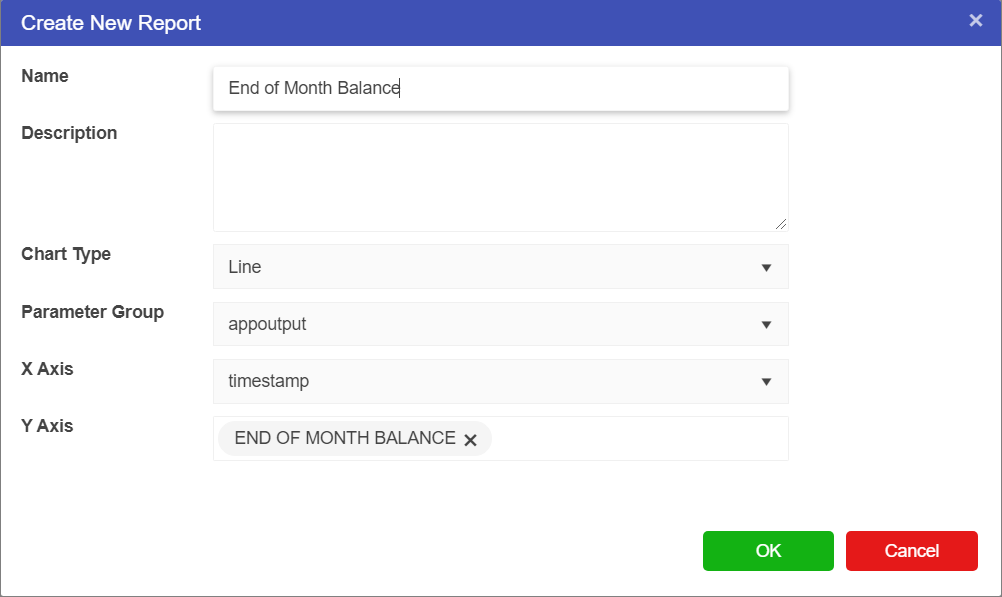
A New Report window will appear. When appear enter the following:
- Rename the report so you can find it again later (We used End of Month Balance).
- Set the Chart Type to Line.
- Set the Parameter Group to appoutput.
- Set the X-axis to timestamp.
- Set the Y-axis to End of Month Balance.
- Then click OK.
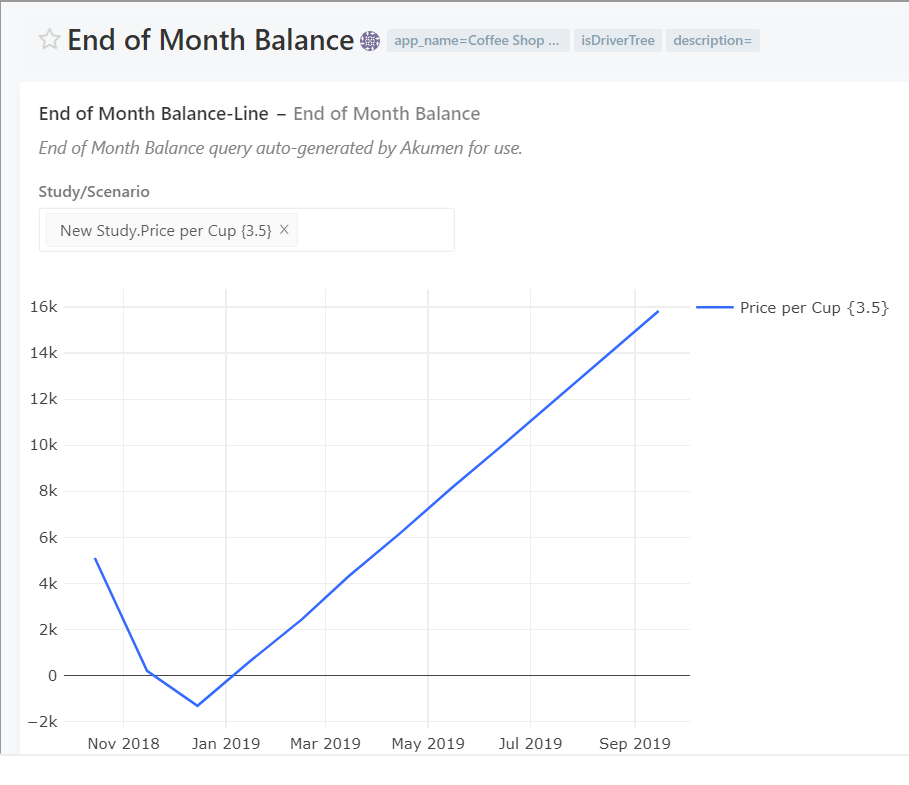
Once you click okay you will be taken to your report’s dashboard.
In this graph you can select which scenario results you want to see, all of them or a selection. To do this click on the Study/Scenario box. to go back to your reports click on Back to Reports List at the top of the dashboard.


