Static Visuals
We have now identified a few scenarios that we probably want to view permanently on our dashboard. To see just these results, and track them, we will create a new query, and use a little bit of code to only track specific scenarios.
To make this new visual we need to go back to our original query and fork it so that we can enter our code into the new query.
- Select the monthly_balances query linked on your dashboard.
- You will be taken to the query screen, and once there you will need to execute the query again to get your results.
- The results will be returned in a table from when the query has run.
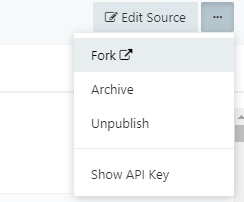
- Then click on the three dots at the top of the screen
 and select Fork from the displayed options.


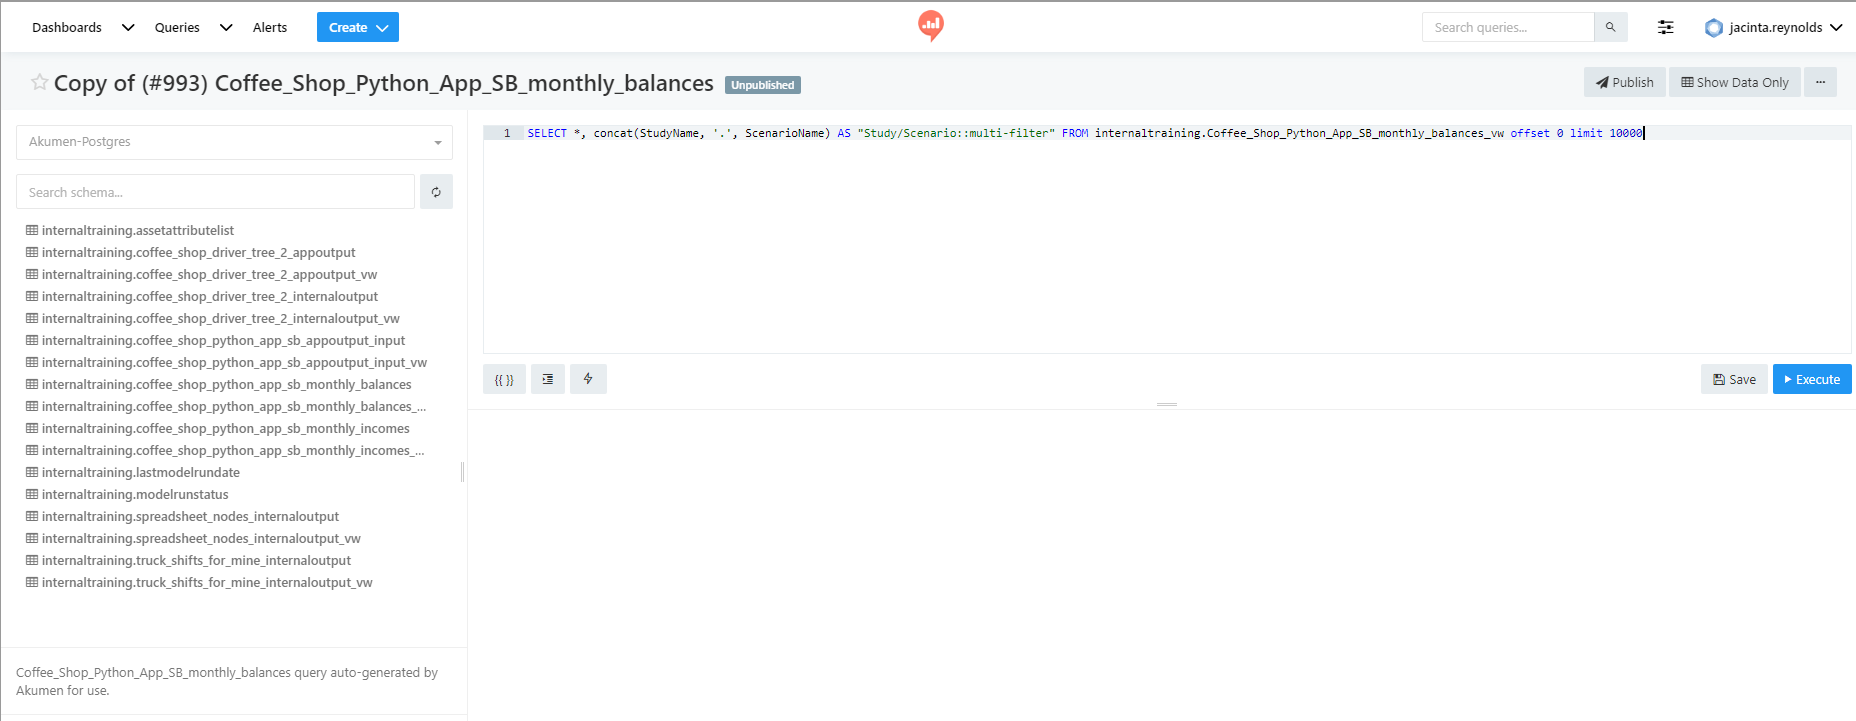
- You will be taken to a new query screen.


At the top of the query you will see a code editor which will have the following line of code: The code above is subject to change after the SELECT *, concat(StudyName, '.', ScenarioName) AS "Study/Scenario::multi-filter" FROM "client"."model"_monthly_balances_vw offset 0 limit 10000 This code is the code that grabs all of the results from all of the scenarios and puts them into your query. We only want to track a few of these scenarios, not all of them so we will edit this code so that it only grabs the results of certain scenarios.
Note
FROM statement. This is because redash is pulling data from your specific model in your specific client. The code above has been changed to represent the basis of what the code in the code editor section of the query screen will look like. So, where “client” is will be replaced with the name of your client, and where “model” is will be replaced with the name of your model.SELECT *, concat(StudyName, '.', ScenarioName) AS "Study/Scenario::multi-filter" is the part of the code which grabs all of the scenarios in all of the studies and pulls them through to our visual. We want to change that so that it only pulls data for specific scenarios such as, 3, 3.5, 3.7, and 4.
- Remove
SELECT *, concat(StudyName, '.', ScenarioName) AS "Study/Scenario::multi-filter"from the code in the code editor part of the query. - Your code should now look like
SELECT * FROM "client"."model"_monthly_balances_vw. - Press enter and type
WHERE. - Press enter again and type
(StudyName = 'Study Name' AND ScenarioName = 'Scenario Name {3}')where Study Name is the name of your study, and Scenario Name is the name of your scenario.Info
You can open a new tab in your explorer by right clicking on Apps and going back into your application to find out what the name of your scenarios are. This is also a good way to check the name of your study. If however you leave your query page you can get back to your source code by selecting your query form the redash queries list and clicking on the button that says Edit Source at the top of the query.


- Save your code and then press Execute.
- You will notice that all the results for that one scenario have been displayed in table below the code editor.
- Now press enter again and type
or, this will allow you to add other specific scenarios. - Add more lines of the code
(StudyName = 'Study Name' AND ScenarioName = 'Scenario Name {3}')for the values of:- 3.5;
- 3.6;
- 3.7; and
-
Note
We suggest that you copy your line of code in the code editor and copy and paste the code changing the values as you go.
- Once all the lines of code are in, save and execute the query.
- Then click on the button at the top of the query screen that says Show Data Only.
- The code editor will disappear and you will be returned to the query screen.
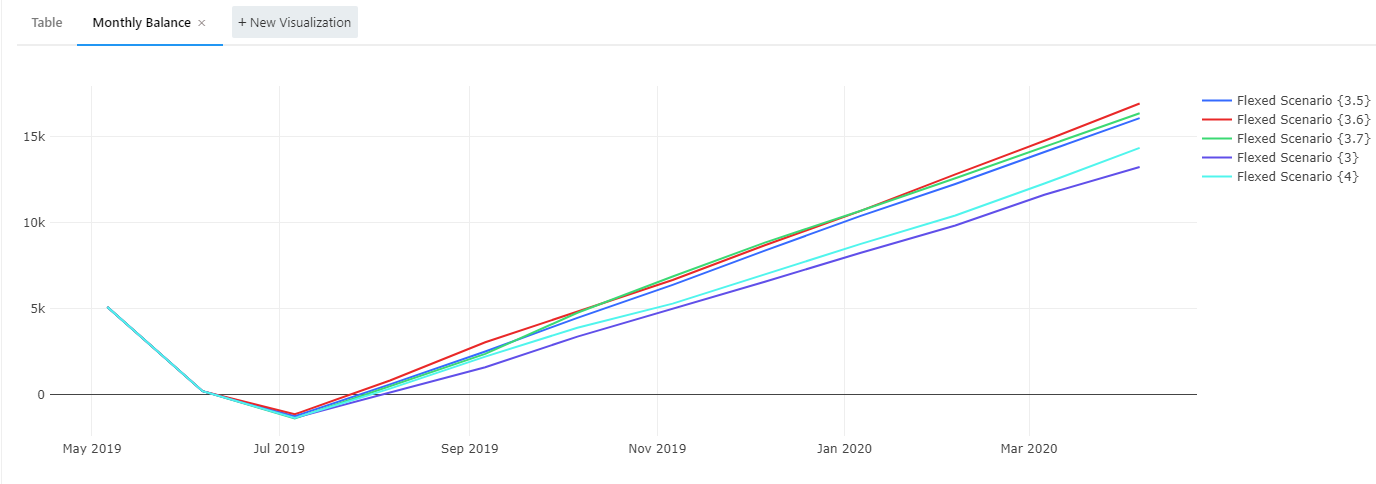
- For here you can follow the steps on the previous page to create your new visual and add it to your dashboard.
You will notice that once again $3.6 and $3.7 appear to be the best prices to charge for a cup of coffee (these values may alternate depending on the distribution values produced every time the model is run).
