Timeseries Nodes
These nodes allow models to predict outcome values for the model over time. They allow users to define a time period and assign values for each of those time periods. The timeseries node will need to be connected to a Calculation node before the values in the timeseries node will affect the Driver Model.
Note
Prior to creating any timeseries nodes, the number of periods and reporting period (below) as well as the start date, can be defined by changing the model properties. In addition, it is sometimes desirable (especially in finance VDMs), to have different scenarios represent different time periods. This can be done by setting the Start Date in the scenario properties.
When setting up a timeseries node, users can define:
- the number of time periods;
- the length of time each period represents - Day, month, Year, etc.; and
- the value for each time period.
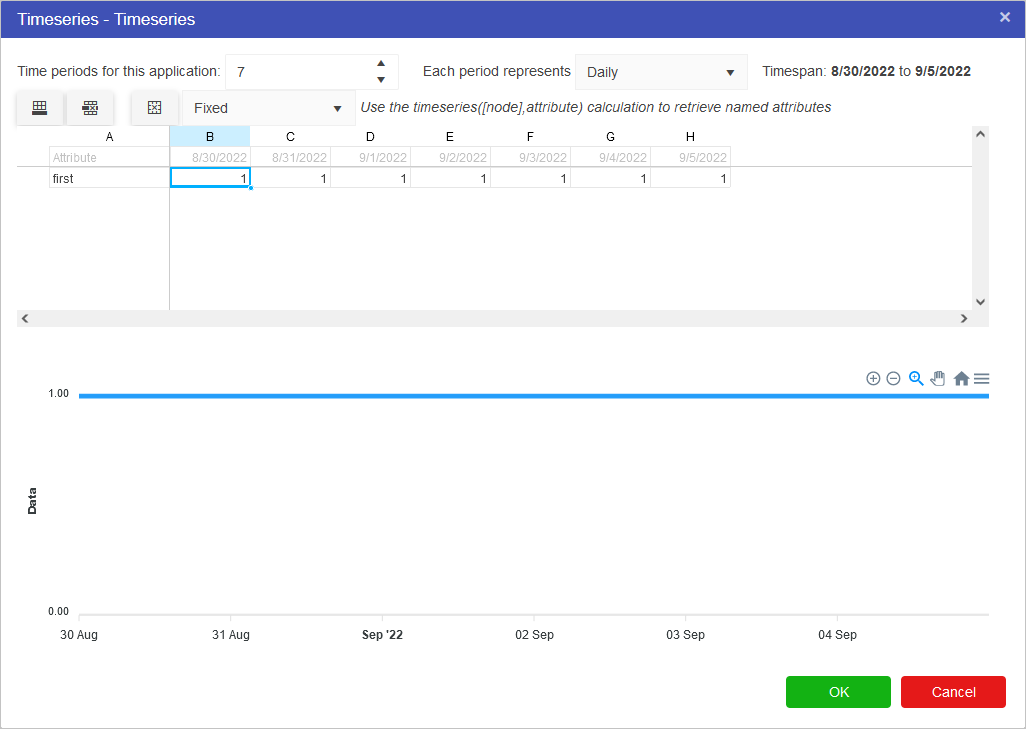
If we, for example, wanted to look at the the value of gold over the course of the week we would put in:
- 7 time periods;
- a Daily time length; and
- 1 for 100% of the original value for the calculated gold amount across the whole time period to start.
Note
Note that the values specified for the number of periods and period type will affect the entire model. If you had two timeseries nodes on the page, altering the number of time periods would affect both nodes. This setting is also available in the model properties.
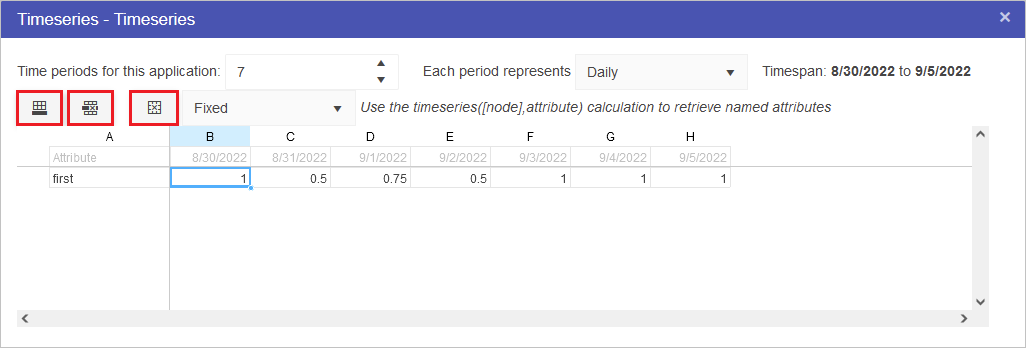
If we knew that the value fluctuated throughout the week between 50% of the value at the start of the week and 100% then we could plan for the worst case and the best case by using scenarios and in the second scenario we could change the timeseries values to 0.5 for 50%.
To set up a Timeseries node:
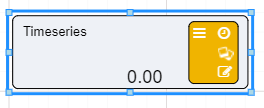
- Drag a Timeseries node using the symbol
 onto the workspace.
 - Click on the 0.00 in the bottom left corner of the node.
- The timeseries editor will open.
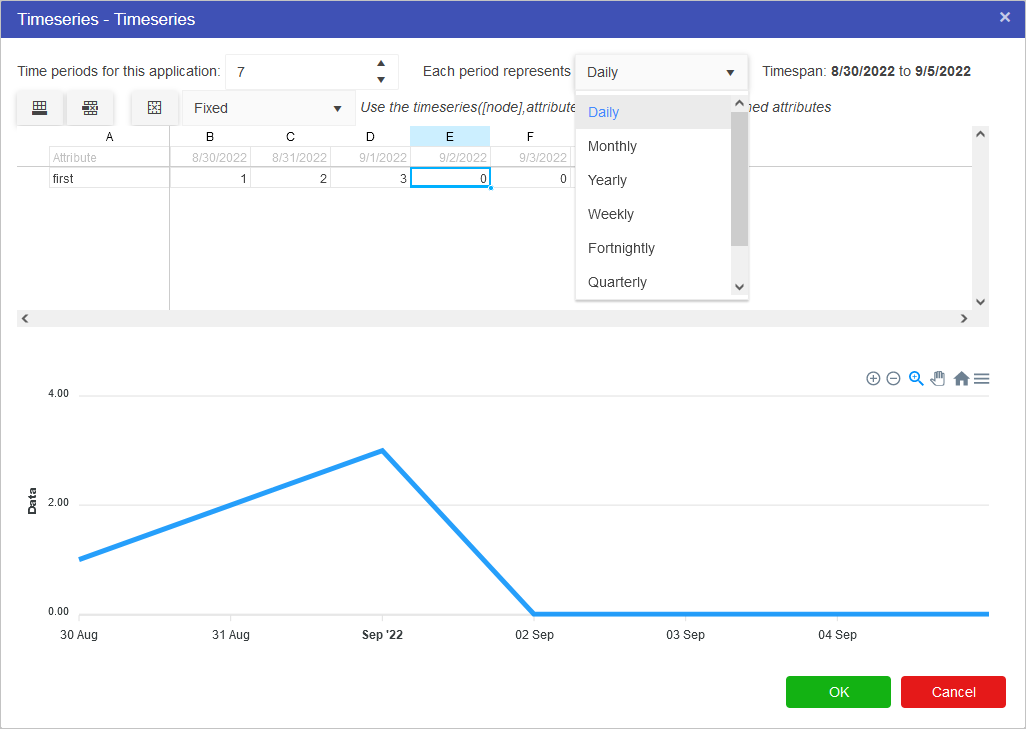
- Enter in the number of time periods.
- Select the length of time each period represents.
- Use the Excel editor to enter in your values.


- The chart will update after your values have been entered into the timeseries spreadsheet.
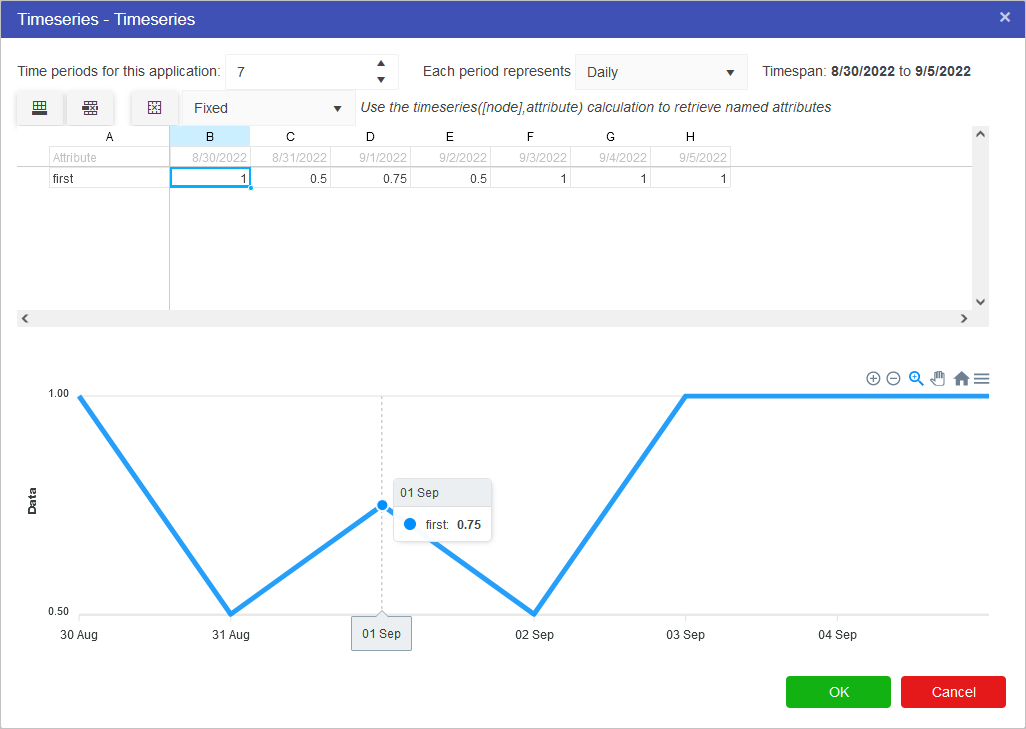

- Press OK To confirm the values.
Whenever a new Timeseries node is added to the Driver Model, a slider will appear at the bottom of the screen. The number of periods displayed in the timeslider are the number of periods specified in the timeseries node OR the model properties. To see the effects over time, simply slide the bar to the next time interval.
Multiple different timeseries sets can be defined per timeseries node. The buttons highlight below control this functionality. From left to right, these options are:
- Add a new row to the timeseries spreadsheet
- Remove selected rows from the timeseries spreadsheet
- Clear all data within the timeseries spreadsheet
The dropdown menu contains options for Fixed, Interpolate and Last Known Value. These work as follows:
- Fixed: This is the default option. Selecting this option will require a fixed value for each month over the defined model period.
- Interpolate: This option allows for missing date values over the defined model period. Where missing data exists, the missing period will be determined via interpolation from the previous and next values in the timeseries sequence.
- Last Known Value: This option allows for missing date values over the defined model period. Where missing data exists, the missing period will be the same as the last period with a known value.
The last day of the month will always be selected if the period increment is set to “Monthly” or “Quarterly” and the model start date is set to the last day of the month. For example, if the model start date is set to 28-Feb-2022 on a quarterly increment, the next period will be 31-May-2022 instead of 28-May-2022.
